该章节程序源代码以及该书中的所有程序,都能在该处找到。
需要注意的是该章节的代码案例是直接从硬盘读取本地运行,而非从web服务器获取。 所以在开发过程中,需要禁止Chrome的安全性问题。 如果在加载图像或其他文件过程中,出现问题,尝试在命令行中添加安全标识。
在 Mac OS X 系统中
/Applications/Google\ Chrome.app/Contents/MacOS/Google\ Chrome
--allow-file-access-from-files --disable-web-security
Linux 系统
chromium-browser --disable-web-securityWindows 系统
chrome.exe --disable-web-security另外,你也可以通过本地服务器来加载页面。
在本章节中,会对数据处理成自定义图表。 你会学到线、形状及文本的基本绘制。之后再制作渐变的饼图。
创建新页面
开始新建 barchart.html文件,内容如下:
<html>
<body>
<canvas width="500" height="500" id="canvas"></canvas>
<script>

    var data = [ 16, 68, 20, 30, 54 ];

</script>
</body>
</html>
上面的页面包括了一个canvas 和 script 元素。
canvas 元素是屏幕上的一个矩形画布。
width和height属性决定了画布的大小。
Canvas 元素与 DIV 一样都是块元素,也可以在页面中设置该样式和定位。
在script 脚本中的data 变量是一组用于绘制饼图的数据集。
在JS脚本设置中设置data变量后,再获取canvas元素及其2d上下文的引用,接着绘制矩形。
// 获取canvas 元素引用
var canvas = document.getElementById('canvas');

// 获取canvas 绘图上下文引用
var c = canvas.getContext('2d');

// 绘制
c.fillStyle = "gray";
c.fillRect(0,0,500,500);
添加数据
Now you can draw some data. Do this by looping over the data array. For each data point fill in a rectangle with the x determined by the array index and the height determined by the data value.
现在开始填充数据。 通过遍历数组,每一个数组元素填充矩形,x 由数组的下标决定,高度由元素值决定。
// 填充绘制
c.fillStyle = "blue";
for(var i=0; i<data.length; i++) {
    var dp = data[i];
    c.fillRect(25 + i*100, 30, 50, dp*5);
}
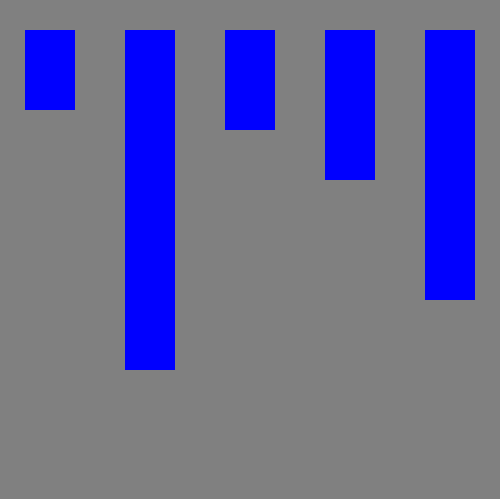
现在刷新你的浏览器。如图:
屏幕快照 平面数据条
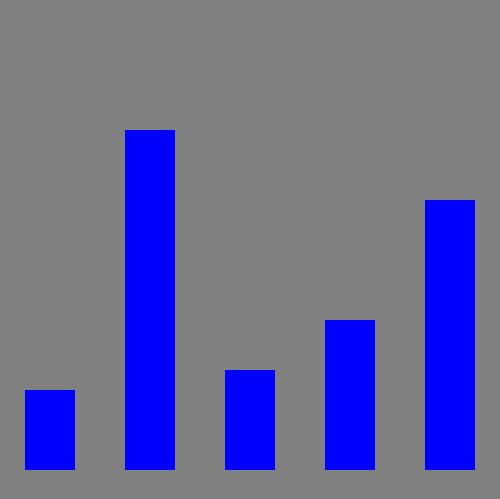
The first problem is that the bars are coming down from the top instead of the bottom. Remember that the y axis is 0 at the top and increases as you go down. To make the bars come up from the bottom change the y value to be calculated as the height of the canvas (500) minus the height of the bar (dp*5) and then subtract off an extra 30 to make it fit.
第一个问题是条形是从上往下增长的,而非从下到上。因为y轴值为0在上面,向下为正方向增加。 为了让条形块从下往上增长,需要计算y的值。该值求得为 canvas (500)的高度减去条形的高度(dp * 5), 再减去30的偏移量。
// 填充数据
c.fillStyle = "blue";
for(var i=0; i<data.length; i++) {
    var dp = data[i];
    c.fillRect(25 + i*100, 500-dp*5 - 30 , 50, dp*5);
}
现在看起来这样:
屏幕快照 修正排列方向
轴线与标签
从定点开始在左边及底部,通过描边路径添加轴线。
// 添加轴线
c.fillStyle = "black";
c.lineWidth = 2.0;
c.beginPath();
c.moveTo(30,10);
c.lineTo(30,460);
c.lineTo(490,460);
c.stroke();
接着在左侧添加刻度值
// 绘制文本及短线
c.fillStyle = "black";
for(var i=0; i<6; i++) {
    c.fillText((5-i)*20 + "",4, i*80+60);
    c.beginPath();
    c.moveTo(25,i*80+60);
    c.lineTo(30,i*80+60);
    c.stroke();
}
最后添加头五个月年份底部的标签。
var labels = ["JAN","FEB","MAR","APR","MAY"];
// 绘制水平文本
for(var i=0; i<5; i++) {
    c.fillText(labels[i], 50+ i*100, 475);
}
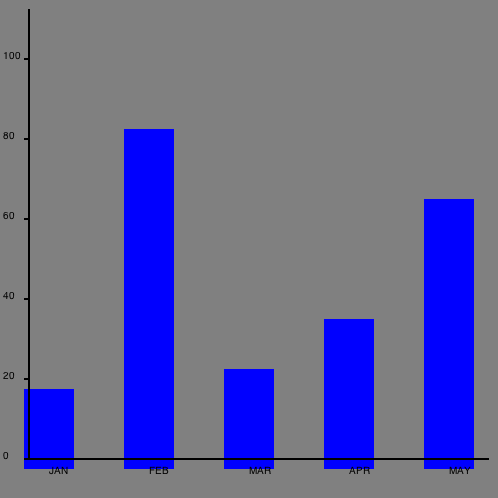
The result looks like this:
屏幕快照 包含轴线及标签的图表
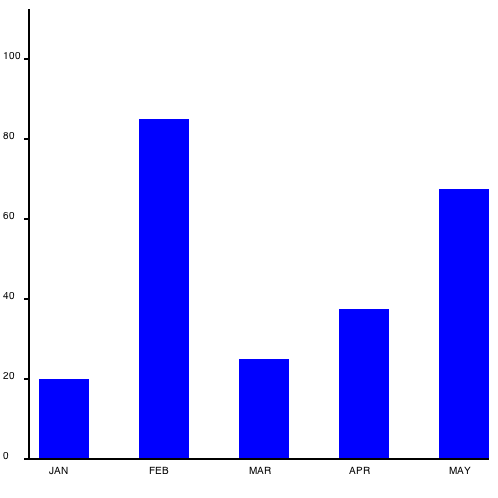
我们还需要做一些调整。先将背景变成白色让看起来色调没有那么沉,然后调整条形位置从(0, 0)开始。
// 绘制背景
c.fillStyle = "white";
c.fillRect(0,0,500,500);

// 填充数据
c.fillStyle = "blue";
for(var i=0; i<data.length; i++) {
    var dp = data[i];
    c.fillRect(36 + i*100, 460-dp*5 , 50, dp*5);
}
现在最终的图表看起来是这样的:
屏幕快照 改进的条形图
饼图
现在让我们使用相同的数据绘制饼图。代码会非常相似的。
新建文档,命名为piechart.html
包含内容:
<html>
<body>
<canvas width="500" height="500" id="canvas"></canvas>
<script>
// 初始化数据集
var data = [ 100, 68, 20, 30, 100 ];

var canvas = document.getElementById('canvas');
var c = canvas.getContext('2d');
// 填充背景
c.fillStyle = "white";
c.fillRect(0,0,500,500);

</script>
</body>
</html>
现在增加一个颜色的列表以及计算数据集的和。
// 颜色列表
var colors = [ "orange", "green", "blue", "yellow", "teal"];

// 计算数组的总和
var total = 0;
for(var i=0; i<data.length; i++) {
    total += data[i];
}
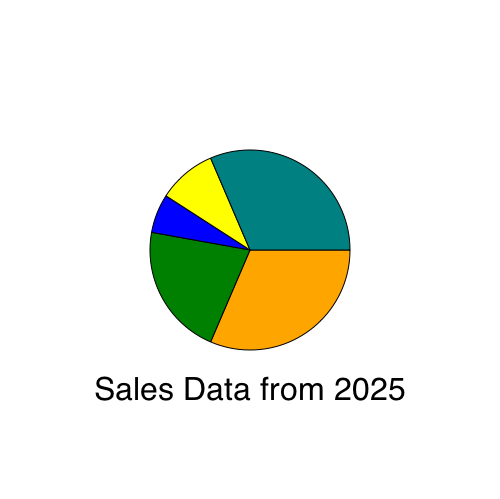
绘制扇形看起来很复杂,实际上很容易。 每一个扇形从圆心为(250, 250)的圆开始,绘制从上一个角度到新角度的弧线。 角度是由饼图的数据部分组成的,转换成弧度制。上一个角度是之前循环绘制结束之后的角度(从0开始)。 弧线的中心在(250,250)半径为 100,接着绘制一条线回到中心,填充并描边。
// 绘制饼图数据
var prevAngle = 0;
for(var i=0; i<data.length; i++) {
    // 每部分所占分数
    var fraction = data[i]/total;
    // 计算开始角度
    var angle = prevAngle + fraction*Math.PI*2;

    // 绘制扇区部分
    c.fillStyle = colors[i];

    // 创建路径
    c.beginPath();
    c.moveTo(250,250);
    c.arc(250,250, 100, prevAngle, angle, false);
    c.lineTo(250,250);

    // 填充
    c.fill();

    // 描边
    c.strokeStyle = "black";
    c.stroke();

    // 更新下一扇形的起始角度
    prevAngle = angle;
}
最后添加在图表下添加一些文本。 让文本居中,必须先计算文本的宽度:
// 绘制居中文本
c.fillStyle = "black";
c.font = "24pt sans-serif";
var text = "Sales Data from 2025";
var metrics = c.measureText(text);
c.fillText(text, 250-metrics.width/2, 400);
然后看上去:
添加渐变
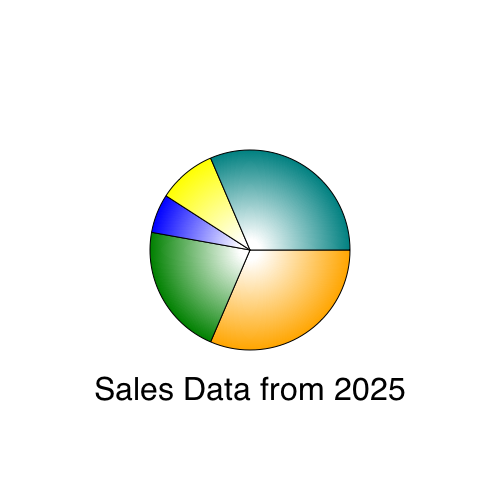
为了让图表看上去更艳丽,可以给每块添加径向渐变,像这样:
// 绘制扇区部分
//c.fillStyle = colors[i];

// 填充径向渐变
var grad = c.createRadialGradient( 250,250, 10, 250,250, 100);
grad.addColorStop(0,"white");
grad.addColorStop(1,colors[i]);
c.fillStyle = grad;
白色到各块的颜色渐变填充了从中心到边缘的扇形,图表添加了一些深度变化。看起来这样:
为了让该图表更实用,读者可以尝试进行以下的一些改进提高。
- 新增数据变成12个月份。
- 创建线表,将每个数据绘制成圆,并使用折线连接。
- 使用渐变填充,圆角或者黑色轮廓美化饼图。
- 绘制每部分饼图的标签